Our solar portfolio currently consists of three stocks - First Solar (FSLR), Jinko Solar (JKS) and MEMC Materials (WFR) all three positions where initiated at the close of the market on November 29 2012
Peter Lynch for | InvestorIdeas.com
Our solar portfolio currently consists of three stocks - First Solar (FSLR), Jinko Solar (JKS) and MEMC Materials (WFR) all three positions where initiated at the close of the market on November 29 2012 at the following prices – FSLR - $27.21, JKS - $4.44, WFR - $2.98.
This portfolio closed the year UP 20.7% in a little over of month of trading.
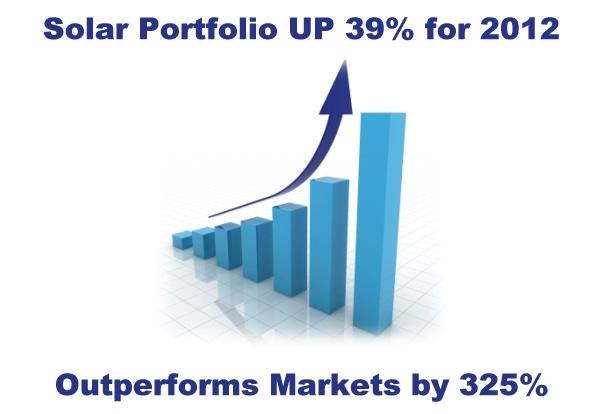
In the beginning of the 2012 we also initiated a portfolio, held the stocks for a total of 9 weeks and closed out the portfolio with a gain of 18.98%. For a total 2012 year return of 39.7% (18.98% + 20.7%).
Note that we achieved this healthy return of 39.7% return only being in the market (i.e. at risk) for 25% of the time with the solar sector as a whole being DOWN 13.93% on average.
2012: Solar Portfolio outperforms markets by 325%
Solar Portfolio + 39.7%
Solar Industry Average - 13.93%
Major Markets Average + 12.19%
|
Solar Stock Portfolio vs Major Indexes for 2012 |
|||
|
Symbol |
Company Name |
Closing Price 2012 |
% Change in 2012 |
|
ASTI |
Ascent Solar Technologies, Inc. |
0.62 |
58.97 |
|
CSIQ |
Canadian Solar Inc. |
3.4 |
27.82 |
|
CSUN |
China Sunergy Company Ltd. |
1.42 |
26.79 |
|
DQ |
Daqo New Energy Corp. |
7.96 |
-4.67 |
|
DSTI |
DayStar Technologies Inc. |
1.52 |
-1.299 |
|
EMKR |
EMCORE Corporation |
4.3 |
24.67 |
|
FSLR |
First Solar, Inc. |
30.86 |
-8.59 |
|
GTAT |
GT Advanced Technologies Inc. |
3.03 |
-58.15 |
|
HSOL |
Solarfun Power Holdings Co. |
1.01 |
3.061 |
|
JASO |
JA Solar Holdings Co., Ltd |
4.27 |
-36.27 |
|
JKS |
JinkoSolar Holding Company Ltd. |
6.21 |
24.2 |
|
LDK |
LDK Solar Company Ltd. |
1.44 |
-65.63 |
|
RSOL |
Real Goods Solar, Inc. |
0.76 |
-46.85 |
|
SOL |
ReneSola, Ltd. |
1.54 |
0.654 |
|
SPIR |
Spire Corporation |
0.5 |
-20.63 |
|
SPWR |
Sunpower Corporation |
5.62 |
-9.79 |
|
STP |
Suntech Power Holdings |
1.53 |
-30.77 |
|
TSL |
Trina Solar Limited (China) |
4.34 |
-35.03 |
|
WEST |
Akeena Solar, Inc. |
0.05 |
-84.38 |
|
WFR |
MEMC Electronic Materials, Inc. |
3.21 |
-18.53 |
|
YGE |
Yingli Green Energy Holding Company Ltd. |
2.35 |
-38.16 |
|
Average % Change in 2012 |
-13.93% |
||
|
Major Indexes 2012 Return |
|||
|
SPX |
S&P 500 |
1426.19 |
13.41% |
|
DOW |
Dow Jones |
13104.14 |
7.26% |
|
NASD |
NASDAQ |
3019.51 |
15.91% |
Stop Loss Points
We sold all the positions in our first 2012 portfolio when they hit their stop loss points that were set very close due to the fact that the market was very over bought and overdue for a correction.
We adhered to our system and did not question whether to sell or not. If one of our positions hit the designed stop point we sold – without question. By doing this we minimized our losses and rode our gains as far as we could.
---------------------------------------------------------------------------------------------------------------------
Remember – the number one rule of investing:
Minimize your LOSSES and Maximize your GAINS.
---------------------------------------------------------------------------------------------------------------------
Current Portfolio Status
At the current time we are holding all three stocks in the current portfolio and added two new positions at the close on the 31st - JASO @ $4.27 and SPWR @ $5.62
Market Psychology
The HARDEST THING for investors to do is know when to sell. That is why you have to set specific, non-emotional prices to exit if things do not go right. You cannot allow your emotions to get involved and take over your thinking.
Trust in your system and follow it regardless of what you think “should happen”. Once you try to impose your will on your portfolio you will stop paying attention to what is most important - “what is” NOT what you think it should be.
Remember this system has enabled us to significantly outperform the rest of the solar sector and the general markets in 2012 as well as in 2010 and 2011:
Summary Performance for 2010 and 2011
2010: Solar Portfolio outperforms markets by 310%
Solar Portfolio + 42.94%
Solar Industry Average -14.2%
Major Markets Average + 13.87%
2011: Solar Portfolio outperforms markets by 1,416%
Solar Portfolio + 17.56%
Solar Industry Average - 70.3%
Major Markets Average + 1.24%
Looking at it in a different way if you had invested $10,000 in each of three portfolios at the beginning of 2010 - our solar portfolio, the solar industry as a whole and the average of the major indexes (this is the average of the Dow Jones, The S&P 500 and the NASDAQ) below would be your portfolio totals as of the end of 2012.
Solar Portfolio = $ 23,475
Solar Industry Sector = $2,191
Average of Major Markets - $ 12,933
The solar portfolio has significantly outperformed BOTH the solar industry as a whole and the general markets ALL with substantially less risk.
Background Analysis Notes
Keep in mind that there are two basic types of equity (stock) analysis. Below are a brief description of each and its primary purpose:
Fundamental Analysis – this is the analysis of the fundamental financial condition of a company to identify which stocks you may want to buy when the timing is right. This form of analysis will give you NO indication of the best time to buy a stock or sell a stock.
Technical Analysis – this form of analysis will tell you “when” to buy a stock and when to sell the stock. It will do this by showing you (in chart format) the basic interaction of supply and demand and when the two change and shift which will indicate a time to buy or a time to sell.
Mr. Lynch has worked, for 36 years as a Wall Street security analyst, an independent security analyst and private investor in small emerging technology companies. He has been actively involved in following developments in the renewable energy sector since 1977 and is regarded as an expert in this field. He was the contributing editor for 17 years to the Photovoltaic Insider Report, an early publication in PV that was directed at industrial subscribers, such as major energy companies, utilities and governments around the world. He is currently a private investor and has from time to time been a financial/technology consultant to a number of companies. He can be reached via e-mail at: SOLARJPL@aol.com. Please visit his website for the promotion of solar energy – www.sunseries.net.
The content & opinions in this article are the author’s and do not necessarily represent the views of AltEnergyMag
Comments (0)
This post does not have any comments. Be the first to leave a comment below.
Featured Product


