Lincoln International is pleased to present you with the latest DealReader from our global Renewable Energy Industry group.
Q2 2014 Solar Energy Deal Volume Comparison
Contributed by | Lincoln International
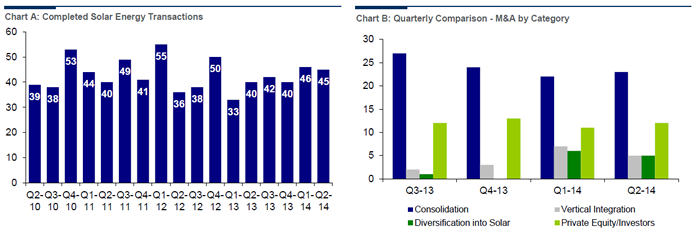
There were 45 completed solar energy transactions in Q2 2014 compared to 40 in Q2 2013. This number is a slight decrease from the 46 transactions recorded in Q1 2014, but is above both Q3 and Q4 2013 levels.
Within solar energy transactions, consolidation represented 51% of transactions, or 23 deals in Q2 2014. The next largest category was investment by private equity/investors with 12 transactions, or 27% of the Q2 2014 total. Vertical integration within the solar industry, as well as diversification into the solar industry, accounted for five transactions, or 15% of the total transactions this quarter, respectively.

In Q2 2014, 36% or 16 of the 45 total transactions occurred in Europe. This represents an 8% decrease in share from Q1 2014. U.S. / Canada exhibited an increase in activity recording 16 transactions or 36% of the total in Q2 2014, up from 14 transactions, or 30% of total in the previous quarter. Asia accounted for 10 transactions, or 22%, which is above the total for the previous two quarters. Additionally, Cross-Continental recorded three transactions during Q2 2014, which represented 7% of the total. South America did not record a transaction.
In addition, there were 28 transactions for solar energy producers, or 62% of the total, which is above the 22 recorded in Q1 2014. This quarter there were nine acquisitions of EPC integrators / developers, or 20% of the total transaction volume. There were six transactions for companies categorized as providers of equipment for solar, or 13% of total activity, while companies categorized as cell / module producers accounted for two transactions, or 4% of the Q2 2014 total. No transactions categorized as wafer / ingot producers or vertically integrated companies were recorded during the quarter.
Following a pick up in acquisition activity during Q1 2014, activity remained above 2013 levels in Q2 2014. Consolidation for producers of solar power continued to be the primary source of deal activity, in addition to significant volume from the private equity / investors category. Activity remained significantly weighted to the more established markets in Europe and North America, with nearly 75% of all transactions in Q2. Activity overall has remained strong in the solar industry with continued consolidation of project portfolios as well as additional vertical integration across the value chain. In addition investment in solar through private investment continues to remain at a strong level given the availability of capital and debt leverage in the market place.

An Analysis of Global Solar Energy Trends
Solar market growth picked up in 2013, after being somewhat level in 2012. The market increased as solar is continuing to become a larger source of power generation, expected to surpass 130 GW of cumulative installed capacity globally this year.
In 2014, the market is expected to continue to grow, but not as strong as it has historically due to continued slowness in the European markets with an offset given the strong growth in Asia and the United States. Moving forward, growth in demand is expected to be driven by price decreases for the balance of solar systems and the development of previously untapped markets. This trend is demonstrated in Chart F, where after an increase in 2014, the solar industry is expected to return to moderate expansion from 2015 to 2018.
Europe has traditionally dominated the solar market, but the rest of the world has been catching up at a rapid pace. In fact, Europe’s share of the market shrunk from 76% in 2011 to 56% in 2013. It is expected that the market will continue to diversify in 2014, with Europe’s share falling below 50%. Outside of Europe, the market is well-balanced. China, the United States and Japan are leaders with great potential for future growth. In 2013, China became the second largest solar market globally ahead of Italy, Japan and the United States, as illustrated in Chart G. These four geographies were followed by developing countries who could represent strong geographies for PV growth in the future.
Currently, the split between rooftop and utility-scale solar installations is weighted toward the rooftop segment, as shown in Chart H. However, this separation is expected to contract in the future as utility-scale plants are forecasted to exhibit faster growth globally. In certain markets, such as the U.S., rooftop projects are still expected to experience faster growth as solar leasing programs and other financing structures provide more availability to residential and small commercial projects.

About Lincoln International
 Lincoln International specializes in merger and acquisition advisory services, debt advisory services, private capital raising and restructuring advice on mid-market transactions. Lincoln International also provides fairness opinions, valuations and pension advisory services on a wide range of transaction sizes. With sixteen offices in the Americas, Asia and Europe, Lincoln International has strong local knowledge and contacts in key global economies. The firm provides clients with senior-level attention, in-depth industry expertise and integrated resources. By being focused and independent, Lincoln International serves its clients without conflicts of interest. More information about Lincoln International can be obtained at www.lincolninternational.com.
The content & opinions in this article are the author’s and do not necessarily represent the views of AltEnergyMag
Comments (0)
This post does not have any comments. Be the first to leave a comment below.
Featured Product

