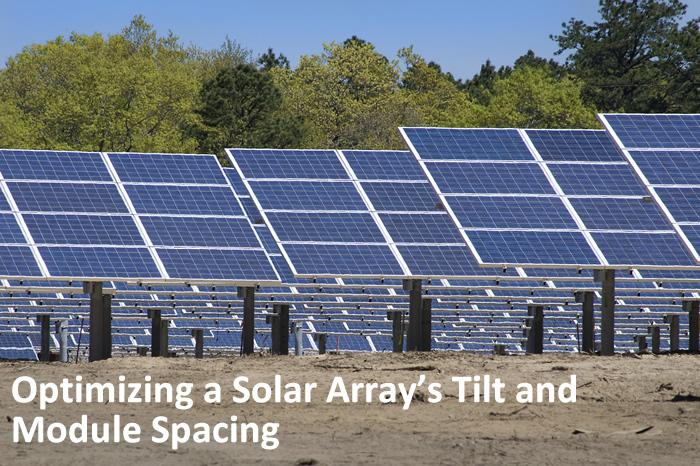
System optimization is more than just good-looking charts - in this case, we are able to increase system profit by $40k, an increase of over 70% versus the 15º-tilt baseline design.
Contributed by | Folsom Labs
Overview
Module tilt & spacing is one of the most important decisions a solar developer can make about a potential project: these two variables determine both the peak power a site can produce, as well as how effectively that translates into energy for the owner. Yet these metrics are not always given the attention they deserve during the design and engineering process. By optimizing module tilt and spacing, system designers can improve a project’s cost structure by over 10%, improving the profit margins and in some cases making an unattractive project profitable.

The basic tradeoff is straightforward: for a given area, a system engineer must determine how many modules to install. One approach is to maximize the productivity of the modules: set the tilt to maximize the sunlight each module receives, and space them far apart so they don’t shade each other. However, this will leave lots of empty space on the roof, and result in a smaller system. The other extreme is to pack the modules closer together and reduce the tilt (and thus, the shading). This results in a much larger peak power capacity, but the modules are less productive individually. Which approach is best? That depends on many project-specific factors, but new tools are helping developers quickly find the optimal solution for each project. Here we will look at one example.
Optimization Structure
There are just a few variables needed to run an effective tilt/spacing optimization. The available area determines system size, and the system location determines the sun angles and row-to-row shading. We also need to define the equipment used – particularly the solar modules, since their size and efficiency drives the results. Finally, we must define the project’s fixed costs (the costs that don’t vary with the size) and marginal costs (the ones that scale with the module quantity, including the modules themselves, the wires, and the racking).
With the inputs defined, we then vary the tilt and spacing of the modules, as these are the two key determinants of the optimal configuration. These two variables are closely related, as the value for one will determine the effects of the other – so this will be a joint optimization.
While running the optimization scenarios, the primary outputs are the system size (the module quantity; driven by the module spacing) and energy yield (driven by the module orientation and shading losses). These then allow us to calculate the system cost and revenue, and as a result the system profit. See Figure 1 for a summary of the optimization variables.
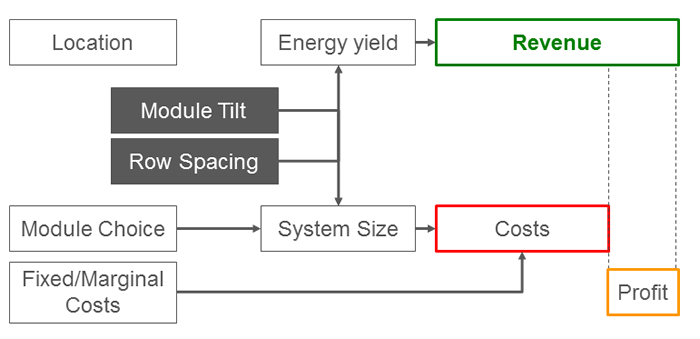
Figure 1: Input & Output Variables for Optimization
Case Study:
To understand how the optimization works in practice, we will use a specific example: a 24,000-square-foot building in Northern California. For the initial baseline, we start with a nominal system design featuring single-module rows tilted at 15º, spaced three feet apart.
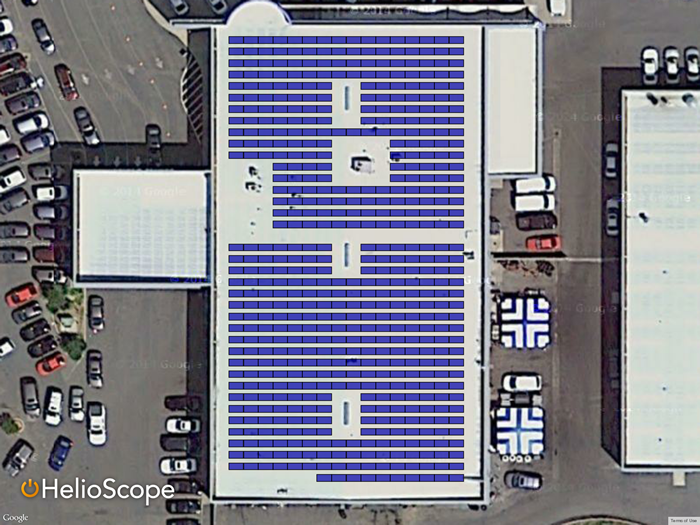
To define the optimization analysis for this rooftop: we will vary the tilt from 5º to 25º, and the spacing from 1’ between rows to 4’ between rows. This joint optimization results in 20 different scenarios (five tilt values and four spacing values) for how we might build the system. This is easy to implement in HelioScope, as the layout functionality enable users to quickly change a design parameter and generate new energy estimates. In order to see the results directly, create a HelioScope account here, and then click this link for access to the Project.
From the first set of scenario results, we can see that for our original 15º tilt, the tighter spacing reduces productivity, just as we expect. By reducing the spacing to 0.5 feet, the yield drops to almost 1,500 Wh/Wp. Similarly, beyond two feet, there isn’t much benefit to spacing the modules further apart.
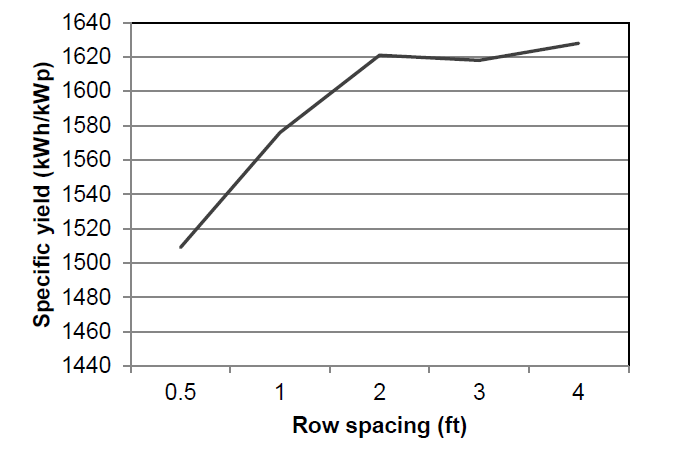
Figure 2: Energy Yield versus Row Spacing, 15º tilt modules
However, if we repeat the same spacing analysis on system with lower tilt, performance is not nearly as sensitive to variation in module spacing, the 10º tilt system demonstrates fairly consistent yield independent of module spacing. On the other hand, the higher-tilt system’s productivity increases when modules are spaced farther apart – but if spaced too closely together, productivity falls quickly.
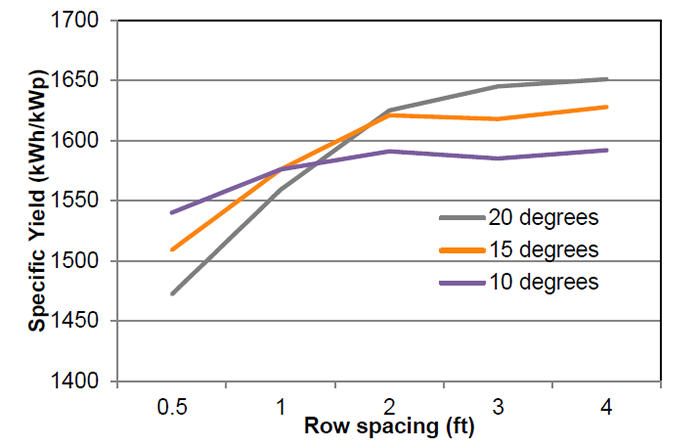
Figure 3: Energy Yield vs. Spacing, for Three Tilt Angles
On productivity alone, one might think that high module tilt and wide spacing is best. But tighter spacing (and therefore larger systems) also has benefits. This is primarily because many installation costs are fixed. For example, the costs to find the customer, submit the permitting documents, plan the work crew, and connect to the grid, are all basically the same, even if the system is 50% bigger. So a larger system can be more profitable, because these fixed costs can be spread over a bigger system.
Factoring in typical system cost and revenue assumptions, the approach that optimizes total system profit features a reduced the tilt and tighter module spacing (in this case, a 10º tilt and 6” row spacing).
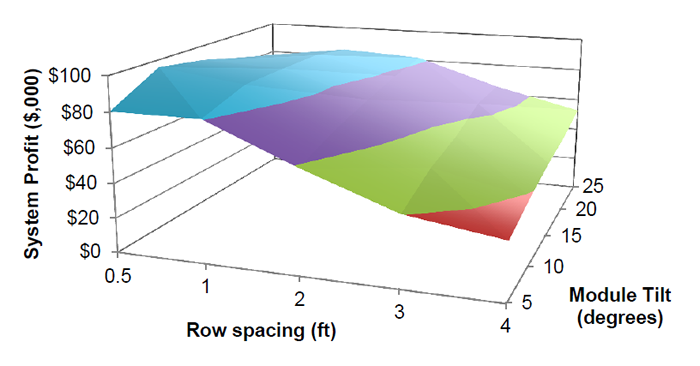
Figure 4: System Profit Dollars versus Module Spacing and Tilt
Taking things one step further, the maximum profit dollars does not necessarily result in the maximum profit margin. For that, a greater tilt and wider module spacing would be optimal (25º tilt and 2’ spacing).
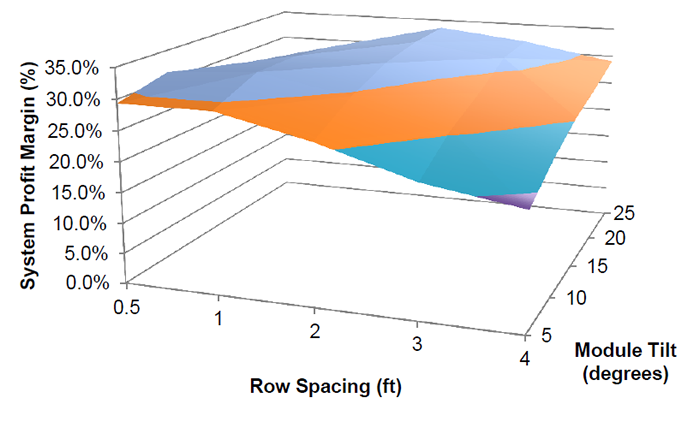
Figure 5: System Profit Margin versus Module Spacing and Tilt
So even with a single set of cost and revenue assumptions, the optimal design depends on the objectives of the owner & builder – which in turn usually depends on the financial structure and capital availability.
Finally, the optimization results will depend significantly on equipment costs. For example, with more expensive modules (driving the marginal cost from $1.75/W to $3.00/W), the optimal design changes to one with a greater tilt and wider spacing – suggesting that one should install fewer modules, each with greater productivity.
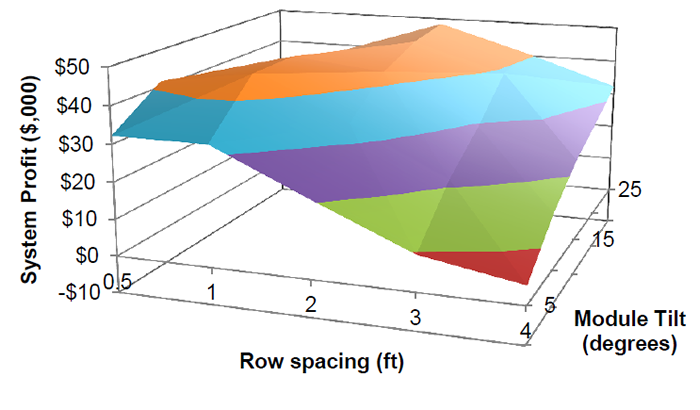
Figure 6: System Profit Dollars versus Spacing and Tilt, with larger Marginal Costs
Closing:
System optimization is more than just good-looking charts – in this case, we are able to increase system profit by $40k, an increase of over 70% versus the 15º-tilt baseline design.
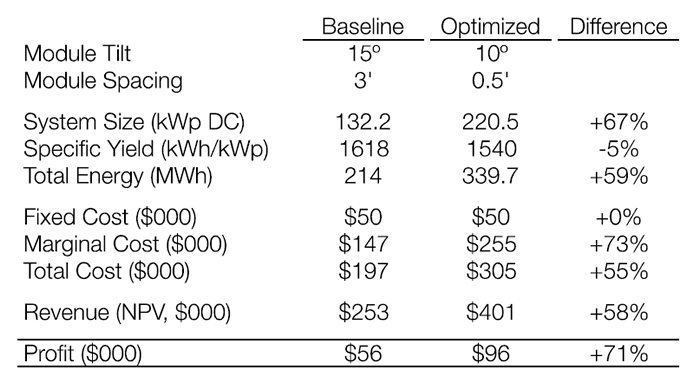
Figure 7: Comparison of Optimized System Design and Profitability
This does not mean every project should be at a 10º tilt – each location is unique. But it does show that optimizing a system’s design can be well worth an engineer’s time.
Folsom Labs
 Folsom Labs develops HelioScope, an advanced PV system design tool that integrates system layout and performance modeling to simplify the process of engineering and selling solar projects.
We founded Folsom Labs because we needed a way to evaluate the performance impact of new technologies on PV system. The only way to do that properly was through detailed component-based analysis. Once we developed the core model behind HelioScope, we realized it could solve many obstacles faced by other system designers.
HelioScope is more than just CAD-caliber layouts, robust shade and wiring loss calculations, module-level electronics modeling, SketchUp integration, and bankable physics. These features are integrated to dramatically simplify the solar design process, making it easy for anyone to generate world-class solar layouts and performance estimates.
The content & opinions in this article are the author’s and do not necessarily represent the views of AltEnergyMag
Comments (0)
This post does not have any comments. Be the first to leave a comment below.
Featured Product
