This year's World Market Updated includes a full chapter dedicated to Direct-Drive WTG versus Gearbox-Equipped WTG. The increased use of the direct-drive turbines across the wind market is impacting the wind industry. The World Market Update 2010 identifies and compares the pros and cons of both the direct-drive and gearbox-equipped concepts, as well as the implications of using permanent magnets on a large scale.

International Wind Energy Development: World Market Update 2010

Contributed by | BTM Consult – A Part of Navigant Consulting


EXECUTIVE SUMMARY

The 100+ page World Market Update 2010 is BTM Consult’s Sixteenth Edition of this annual wind energy market report. The report includes more than 80 tables and graphs illustrating wind market development – one of the world’s fastest growing industries – a five-year forecast to 2015, and predictions for the market through 2020.
 
This year’s World Market Updated includes a full chapter dedicated to Direct-Drive WTG versus Gearbox-Equipped WTG. The increased use of the direct-drive turbines across the wind market is impacting the wind industry. The World Market Update 2010 identifies and compares the pros and cons of both the direct-drive and gearbox-equipped concepts, as well as the implications of using permanent magnets on a large scale.
 
Highlights:
 
  • Record installation of 39.4 GW
  • Strong presence of four Chinese wind turbine suppliers in the “Top 10” list
  • China now the leading market globally, with 18.9 GW of new capacity
  • Offshore wind power is on track for increased contribution to Europe
  • Market value is expected to grow from €66.8 billion in 2011 to €111.7 billion in 2015*
  • Direct-drive turbines now account for 17.6% of the world’s supply of wind power capacity
  • Wind power is expected to deliver 1.92% of the world’s electricity in 2011*
  • Current indications are that wind power is expected to be able to meet 9.1% of the world’s electricity demands by 2020*
 
DEMAND AND MARKET GROWTH IN 2010
 
With 39,404 MW of new installations, the total installed capacity of wind power grew to approximately 200,000 MW. This was an increase in cumulative installations of 25%. In terms of annual installations, there was a modest increase of just 3%. Annual installed capacity has grown by an annual average of 27.4% over the past five years. This outcome happened in the second year after the financial/economic crisis struck the world, including some of the wind industry’s most important mar­kets including the U.S. and Europe.
 
Highlights on the demand side include:
  • 9,404 MW of newly installed wind power capacity
  • Cumulative installed capacity by the end of 2010 reached 199,520 MW. Around 24,000 new wind turbines were erected across more than 50 different countries
  • Europe lost its previous position as the largest wind power continent. 27.9% of all new installation in 2010 took place in Europe, but the continent’s share is decreasing. Four years ago the European share was 51%
  • The Americas dropped dramatically compared to 2009. It was caused by fall in the U.S. market, where 5,115 MW of new capacity was added. That was around half of its installation in 2009 Altogether the Americas accounted for 16.8%
  • Asia experienced significant growth. Including the OECD Pacific, the region increased its cumulative capacity from 42,037 MW in 2009 to 63,645 MW in 2010, a growth of 51.4%. China was by far and away the leading country, with 18,928 MW of new capacity in 2010. India saw an increase to 2,139 MW of new installations. The region as a whole accounted for 54.8% of the year’s global total
  • Among the Top 10 markets China kept its position as largest in 2010, followed by the US. Germany installed 1,551 MW in 2010. UK and Spain improved their position, with 1,522 MW and 1,516 MW respectively
  • Penetration of wind power in the world’s electricity supply has reached 1.92%, the proportion expected to be produced in 2011
 
In the offshore market, nine new projects were installed. The total off­shore installation in 2010 was 1,444 MW Most of new offshore is in­stalled in the UK, but also Denmark and Belgium contributed with large scale projects. Germany saw its second and third project: Baltic 1 and Bard 1 (phase 1) China which entered the offshore arena in 2009 with Donghai Bridge Offshore on the coast off Shanghai and this project was completed in 2010. With a total of 1,444 MW installed in the sea, the cumulative capacity of off shore wind came to 3,554 MW

 
SUPPLY SIDE AND TOP 10 TURBINE MANUFACTURERS
 
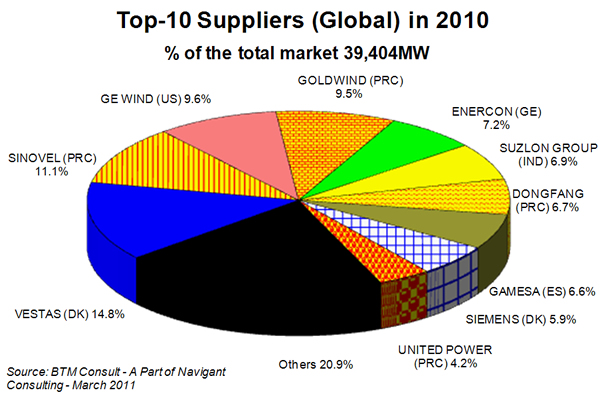
The most significant change in the supply market was the strong growth of Chinese wind turbine suppliers. Four Chinese companies are now among the Top 10 and with strong positions: Sinovel (No. 2), Goldwind (No.4) and Dongfang (No. 7) and United Power (No10).
 
Vestas consolidated its leading position with a market share 14.8%. Sinovel (CN) advanced to a No. 2 surpassing GE Energy. Hereafter follows Goldwind(C), Enercon (GE), Suzlon Group (IND), Dongfang (CN), Gamesa (ES), Siemens Wind (DK) and finally, new on the list is United Power (CN)
 
The five companies below the Top 10 rankings are: Mingyang (CN), Nordex (GE), Mitsubishi (JP) Sewind(CN) and Hara XEMC (CN)


SIGNIFICANT TRENDS IN THE MARKET
 
The most significant trend in the wind market was the booming Chi­nese wind industry. Additional 2010 included:
 
  • Along with a modest upscaling in turbine capacity from the supply of more multi-MW turbines for use on land, the demand for offshore wind turbines was significantly higher than the previous year, with 1,444 MW supplied in 2010. The average turbine size delivered to the market was 1,655 kW, slightly higher than in 2009.
  • A significant trend was the increasing supply of wind turbine concepts with a direct drive design. This emerging technology accounted for around 17.6% of the world market in 2010, represented mainly by Enercon (GE) and Goldwind (CN) and Hara XEMC (CN)
  • In the Asian markets smaller turbines are preferred. The average size delivered to India in 2010 was therefore 1,293 kW, whereas the average delivered to the UK market reached 2,568 kW. In China the average turbine supplied was 1,469 kW
  • Utilities and IPPs are the dominating customer group in today’s market. The Top 15 wind farm operators in this customer segment controlled around 33.6% of the aggregate installed capacity in the world at the end of 2010. They build and in many cases own and operate the largest new wind farms in the US, Spain, China and the UK.
 
ABOUT BTM CONSULT
 
Founded in 1986, Denmark-based BTM Consult is a premier forecaster and data source for the international wind energy sector. Since 1996 BTM Consult has annually published the highly regarded International Wind Energy Development World Market Update, in addition to several other re­curring globally-focused wind market reports, including its first release of the Offshore Wind Report in 2010. On December 20, 2010, BTM Consult became part of Navigant’s global Energy practice. Additional information about BTM Consult can be found at www.navigant.com/btm.
 
ABOUT NAVIGANT
 
Navigant (NYSE: NCI), is a specialized global expert services firm dedi­cated to assisting clients in creating and protecting value in the face of critical business risks and opportunities. Through senior level engage­ment with clients, Navigant professionals combine technical expertise in Disputes and Investigations, Economics, Financial Advisory and Man­agement Consulting, with business pragmatism in the highly regulated Construction, Energy, Financial Services and Healthcare industries to support clients in addressing their most critical business needs. More information about Navigant can be found at www.navigant.com.
The content & opinions in this article are the author’s and do not necessarily represent the views of AltEnergyMag

Comments (0)

This post does not have any comments. Be the first to leave a comment below.


Post A Comment

You must be logged in before you can post a comment. Login now.

Featured Product

SOLTEC – SFOne single axis tracker

SOLTEC - SFOne single axis tracker

SFOne is the 1P single-axis tracker by Soltec. This tracker combines the mechanical simplicity with the extraordinary expertise of Soltec for more than 18 years. Specially designed for larger 72 an 78 cell modules, this tracker is self-powered thanks to its dedicated module, which results into a lower cost-operational power supply. The SFOne has a 5% less piles than standard competitor, what reduces a 75% the labor time.